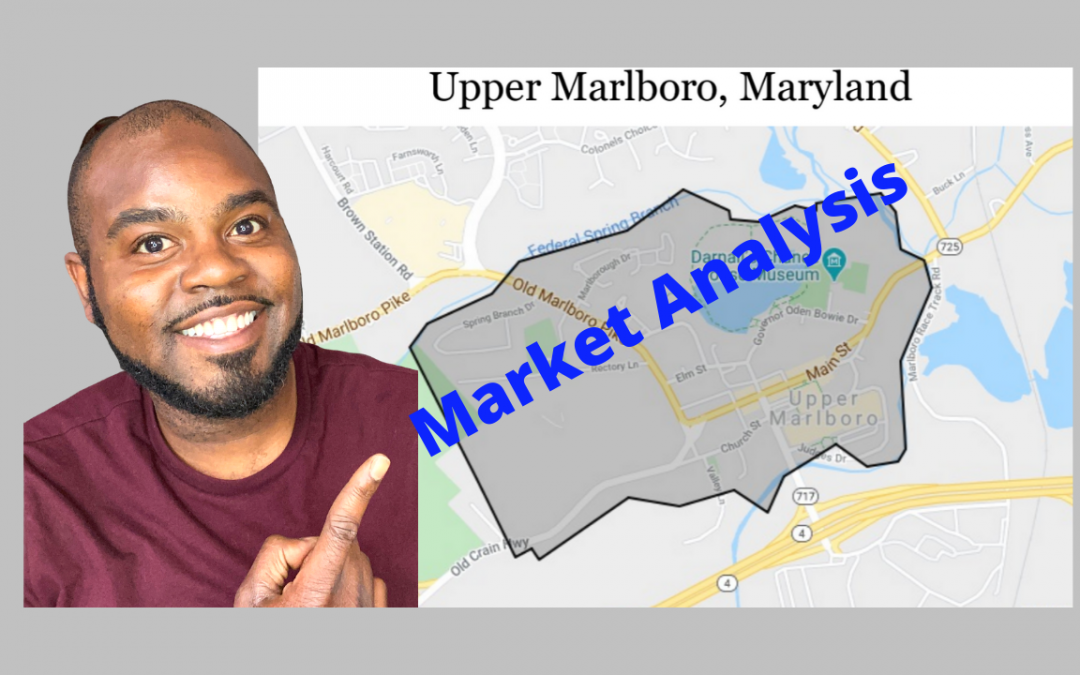
Upper Marlboro is about 45 minutes east of Washington, D.C., and about an hour south of Baltimore. As of the U.S. 2000 census, Greater Upper Marlboro had a population of 18,720 and covered 37.5 square miles. Upper Marlboro offers residents a suburban rural mix feel with many families and retirees that live there. Plus, there is a large percentage of homeownership, which, typically, means heightened attention to the care and maintenance of the community. Beyond that the community hosts numerous attractions like Watkins Park, the Dutch Farmers Market and a host of other family favorites.
The area is divided into several census tracts including parts of Brock Hall, Croom, Marlboro Meadows, Marlboro Village, and Queenland. Upper Marlboro includes Greater Upper Marlboro and the Town of Upper Marlboro. Greater Upper Marlboro completely encircles the incorporated “Town of Upper Marlboro,” which occupies 4/10 of a square mile with a population of less than 700 people.
For this area, I am going to look at those properties that sold in the last 180 days. From there, we’ll talk about the current price for properties – which is what sellers asked for their homes – and we’ll cover the sell price – or what buyers ended up paying for those properties. Plus, we’ll also evaluate days on the market and seller concessions paid by sellers to buyers. All of this information together is based on properties that have sold through May 23, 2020.
Let’s get started.
For All Sold Homes
There have been 743 homes sold in the last 180 days in Upper Marlboro, and the average price for the homes sold was $393,085. This number represents the sum of all properties high and low that were sold. Based on the data more often than not, homes that have sold, have sold for $20,000 less than the average. The median sells price is $378,950. Let’s break down what this difference means, the comparison shows that the sum of all the properties, divided by the total equals to $393,085 for the list of properties. The median shows that from the list of sold properties, $378,950 was the number in the middle of the data set. Now, when I compare this to the market analysis report – which can be accessed here and via my Facebook page, for other reports.
Let’s talk highs and lows. In Upper Marlboro, the most expensive property sold was for $925,000 and there was a steal of a deal for $62,000. This represents $863,00 between the highest valued property and the lowest valued property sold.
Current Price
The current home price is set by the seller prior to any negotiation with a buyer. These figures usually represent what the seller feels their home is worth. On average, the 743 properties sold had a total value of $291.6 million. The property that was the most expensive was listed for $899,000 with the lowest list price being $47,463. If you recall from earlier, the maximum a property sold for was $925,000 or nearly 3 percent (2.89) above the listing price. And in the case for the lowest property value in the data set, a buyer paid 30 percent (30.63%) above the sellers asking price. This metric is curious because it moves the conclusion of this analysis toward obvious appreciation and increase demand for the area; given buyers willingness to pay above the asking price. Realtors Property Resource, RPR, data supports that over the last month, homes in Upper Marlboro have seen a 6.76% increase in values.
Days on the Market
On average sellers had their homes on the market for 36 days. Of course, Coldwell Banker’s internal average time for selling properties is 110% faster than the average. In Upper Marlboro the median time a home was staying on the market was 15 days. The comparison of these two statistics is telling. It shows that, by-in-large, homes in Upper Marlboro are on the market two weeks or less. The mode – the number that appears the most – in this data set is zero (0). This also suggests that homes in that area likely receive multiple offers. An additional reality is that despite Covid-19, homeowners are still listing their property for sell and moving on with their life. Plus, there is a healthy demand from buyers because they are swooping in to claim their piece of Upper Marlboro. The longest a house sat on the market was 462 days in Upper Marlboro with 12 percent of properties selling in zero (0) days. As soon as it went on the market, there was an offer received and accepted before the end of the day.
Seller Concessions
I think that seller concessions are my favorite part of this analysis. Looking at how much people were able to save is just exciting to me. Namely, saving money, for me, is right up there with fresh cut flowers and summer days – it’s a me thing. But, on average sellers paid $11,673 to buyers to help them to close on (buy) a property. Only 534 people received seller concessions of the 734 people that sold their home in the last 180 days, or 72 percent of people that purchased a home received seller concession.
All-in-all Upper Marlboro appears to be attractive an appealing to buyers. And, sellers are willing and looking to sell their home in order to right size up or down or to take advantage of the equity they’ve earned in their property. Additionally, the proximity of Upper Marlboro makes it attractive to families seeking a larger space, reasonable prices, and a sense of separation from DC city living. Also, based on US Census data, the population demographic is largely between 35-54 and the largest school age group being elementary school – further suggesting that individuals choose to move to Upper Marlboro because of the access and the appeal to having a family. And it doesn’t hurt to be in a neighborhood that is appreciating in value.
Brandon Scott is a licensed real estate agent in Washington, DC, Maryland and Virginia. His license hangs with Coldwell Banker Dupont-Logan, DC. He’s been involved in the mortgage finance industry for the last 16 years in various fields. You can reach him by email at [email protected]. Subscribe to his YouTube Channel at RealTea DMV
#realestate #realty #realtor #marketanalysis #maryland #dmv